Our brains are wired somehow to think of everything in terms of a Normal Distribution, aka the “Bell Curve”. It’s a trap that can kill a tech company.
The shape of the curve means that we think of populations of data (such as users) as being a somewhat homogeneous group if only we could compute the average. For example, how many minutes per day “on average” a user spends on a website. Or, the percentage of people “on average” who actively post on a social media platform.
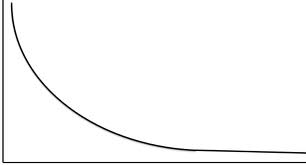
The problem is that populations of people almost never behave in a normal distribution when online or using software products. Instead, the more prevalent pattern of behavior is a Power Law, or Pareto Distribution:
The Pareto distribution is also known as the “80/20 rule”. Except that in online worlds, the ratio can be even closer to “95/5”.
Think of Freemium business models. Generally, 2-8% of users consume a paid offering. The rest use the free version. Power Law/Pareto distribution, not Normal.
Think of participation in social media. 1% are active contributors, 10% are intermittent contributors and 90% consume but never post. Power Law/Pareto distribution, not Normal.
These steep Pareto curves have profound meaning on making choices in running a technology company.
If you operate a Freemium business but don’t know which users are the 5% most likely to upgrade to the paid version, then you risk catering to the needs of the Bell Curve: a population of users that looks more like 50-60% of the whole. Who don’t necessarily pay or monetize.
This is the trap. Chris Anderson touched on this in his book “Free”, by illustrating how the Power Law distribution drives monetization in Freemium business models.
There are other traps by thinking in Normal terms. Beyond Freemium, the Power Law distribution of behavior still applies.
Take Enterprise business models. Every user is a payor, of approximately the same fee. Yet 2-10% of a user population is massively active versus the rest. And with that 10% of users comes maybe 10-20% of the revenue.
Which is your most important segment? Are you trying to solve the problems of those 10% “power users”? Or the needs of the rest?
An example: I managed a product that enabled monitoring of corporate networks and systems for the sake of spotting anomalies. Anomalies which could indicate a security breach in progress, or the risk of one.
Some users spent a large percentage of their day performing the monitoring function for the company. They were specialists who used the product intensively throughout the day. These power users had distinct needs, such as the ability to mine and explore data in depth to spot anomalies for themselves.
The rest of the users were different. They weren’t monitoring specialists. The monitoring role was only one of many roles they played for their companies. Thus, they wanted to spent the least amount of time possible in my product. Instead, they expected the system to alert them automatically, and offer specific actions to take.
Two user populations. Two very different sets of needs. One “market”.
Knowing who your core audience is, and the nature of the Power Law distributions, is essential in setting priorities on which segments to serve. And those that can trap you.
In this post, I’ve only been discussing Power Law in one dimension of meaning (free vs. paid, automated alerting vs. manual trend-spotting). Some of the most interesting Big Data analytics findings come from combining multiple dimensions of meaning, each with its respective Power Law behavior (a simple example: free/paid combined with locale). I’ll tackle that one in a future post….


Yes, statistics in an insanely powerful tool, if used well. Especially if researching multidimensional data. You can always find something interesting, even surprising.
Semi-relatedly, one relatively common misperception amongst end-users is, that if more people are posting about problems with a product than posting praise of a product, it must be bad. Another case for power distribution, I would say. Put happines with product on X axis and strength in voicing opinions on Y.
@Peter: exactly right. The Power Law distribution in this case is people’s propensity to complain versus praise. The ratio is said to be 10:1
Would you say your company takes this into account in designing what should or shouldn’t go into the next versions of the product? If a company listens only to the power users, the product designed can collapse under the weight of feature creep, be priced too expensively, perform lethargically, and/or have more bugs, just due to the additional coding.
I think most companies let the feature creep go on for a while before removing features, if ever. In my most recent experience, doing some deep product analytics helped to understand those features that weren’t used by virtually anyone; that’s the low hanging fruit.